SOLUTIONS
Data & Relationship Analytics Solution
See the relationships hidden in scattered data at a glance.
Everything flows in one path — from upload to charts and graphs to custom dashboards you build yourself. Uploaded datasets are shared between chart visualization and network analytics, so you can move between flat and graph analysis on the same data. With drill-down, keyword search, and chart and report exports, you have everything you need for analysis on a single screen.
Architecture
SUB-SOLUTION 01
Data Upload & Analysis
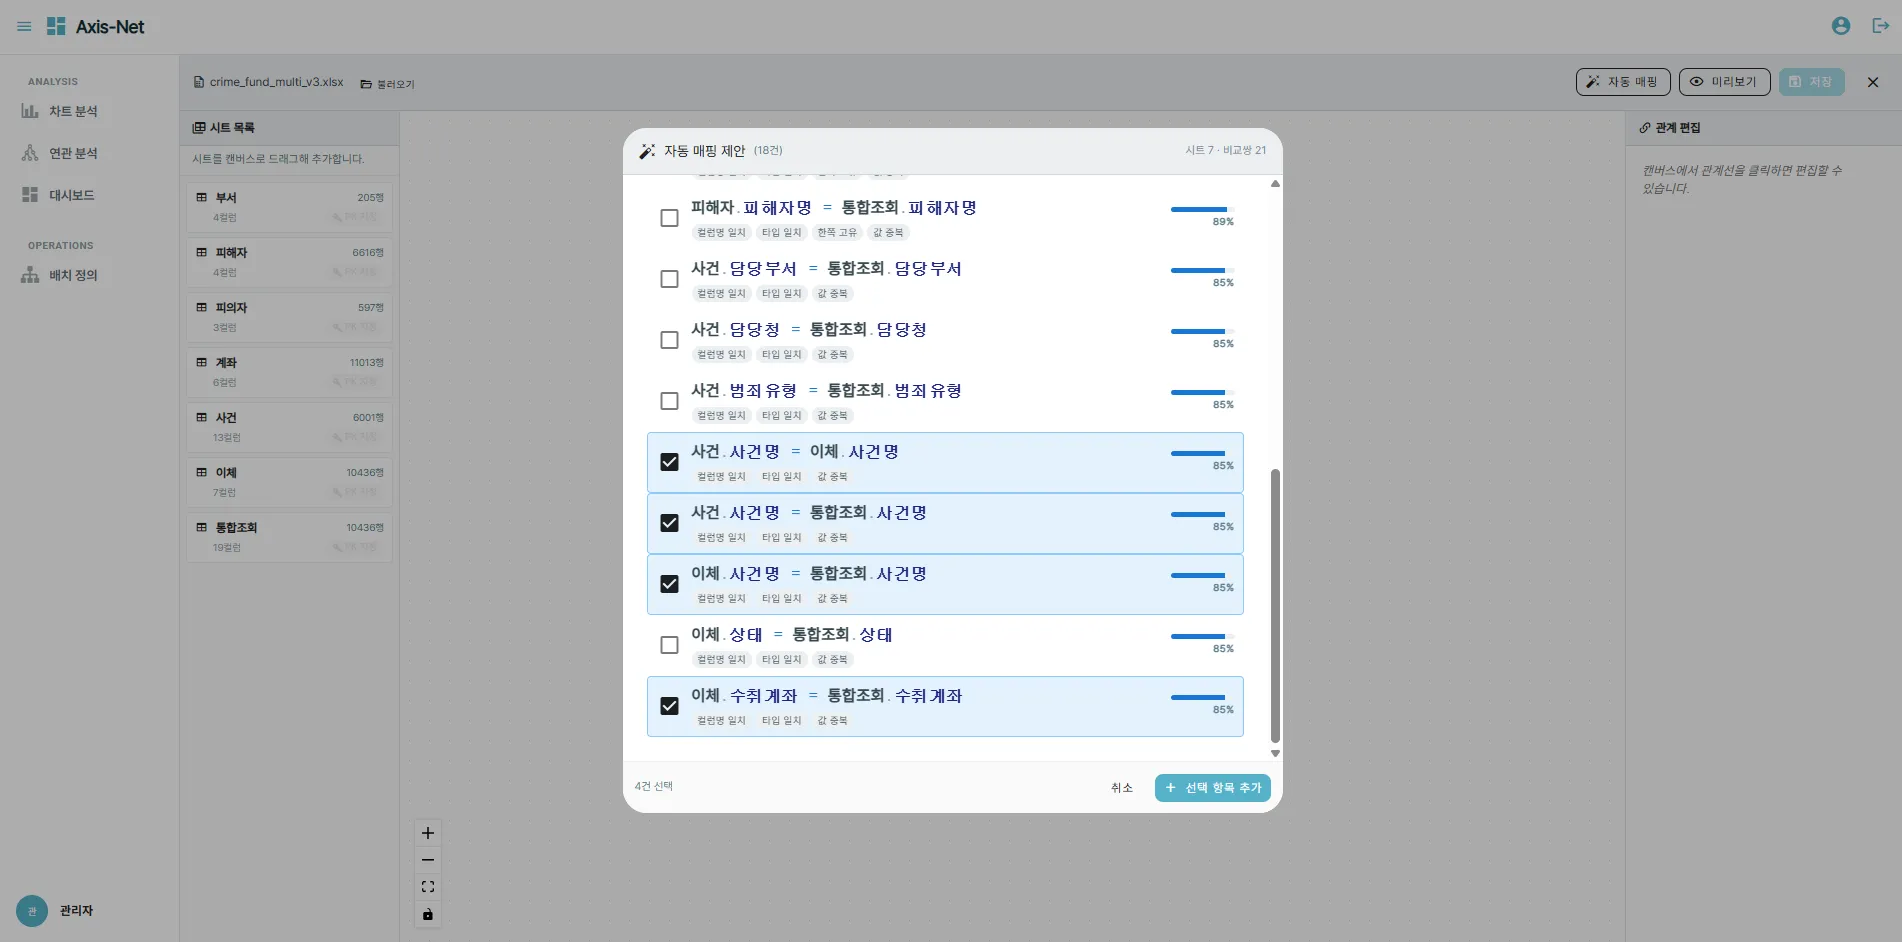
Data Upload & Profiling
Upload an Excel file (.xlsx, .xlsm) and it automatically infers row count, columns, and types (numeric/date/string), making the data ready to analyze immediately. The left field tree distinguishes categories, dates, and measures, while date and category filters help narrow down the data. Review your data in one panel — statistical summaries, Pearson correlation, rankings, and outliers all in one place.
- Instant Schema Inference — Automatically infers row count, column count, and data types
- 8 types of aggregations + Date/Category filters + Row/Column drag & drop
- Analytics Insight Panel — Statistical summary, Pearson correlation, ranking, and outliers
- Uploaded datasets are shared between Chart Visualization (②) and Network Analytics (③)
SUB-SOLUTION 02
Chart Visualization
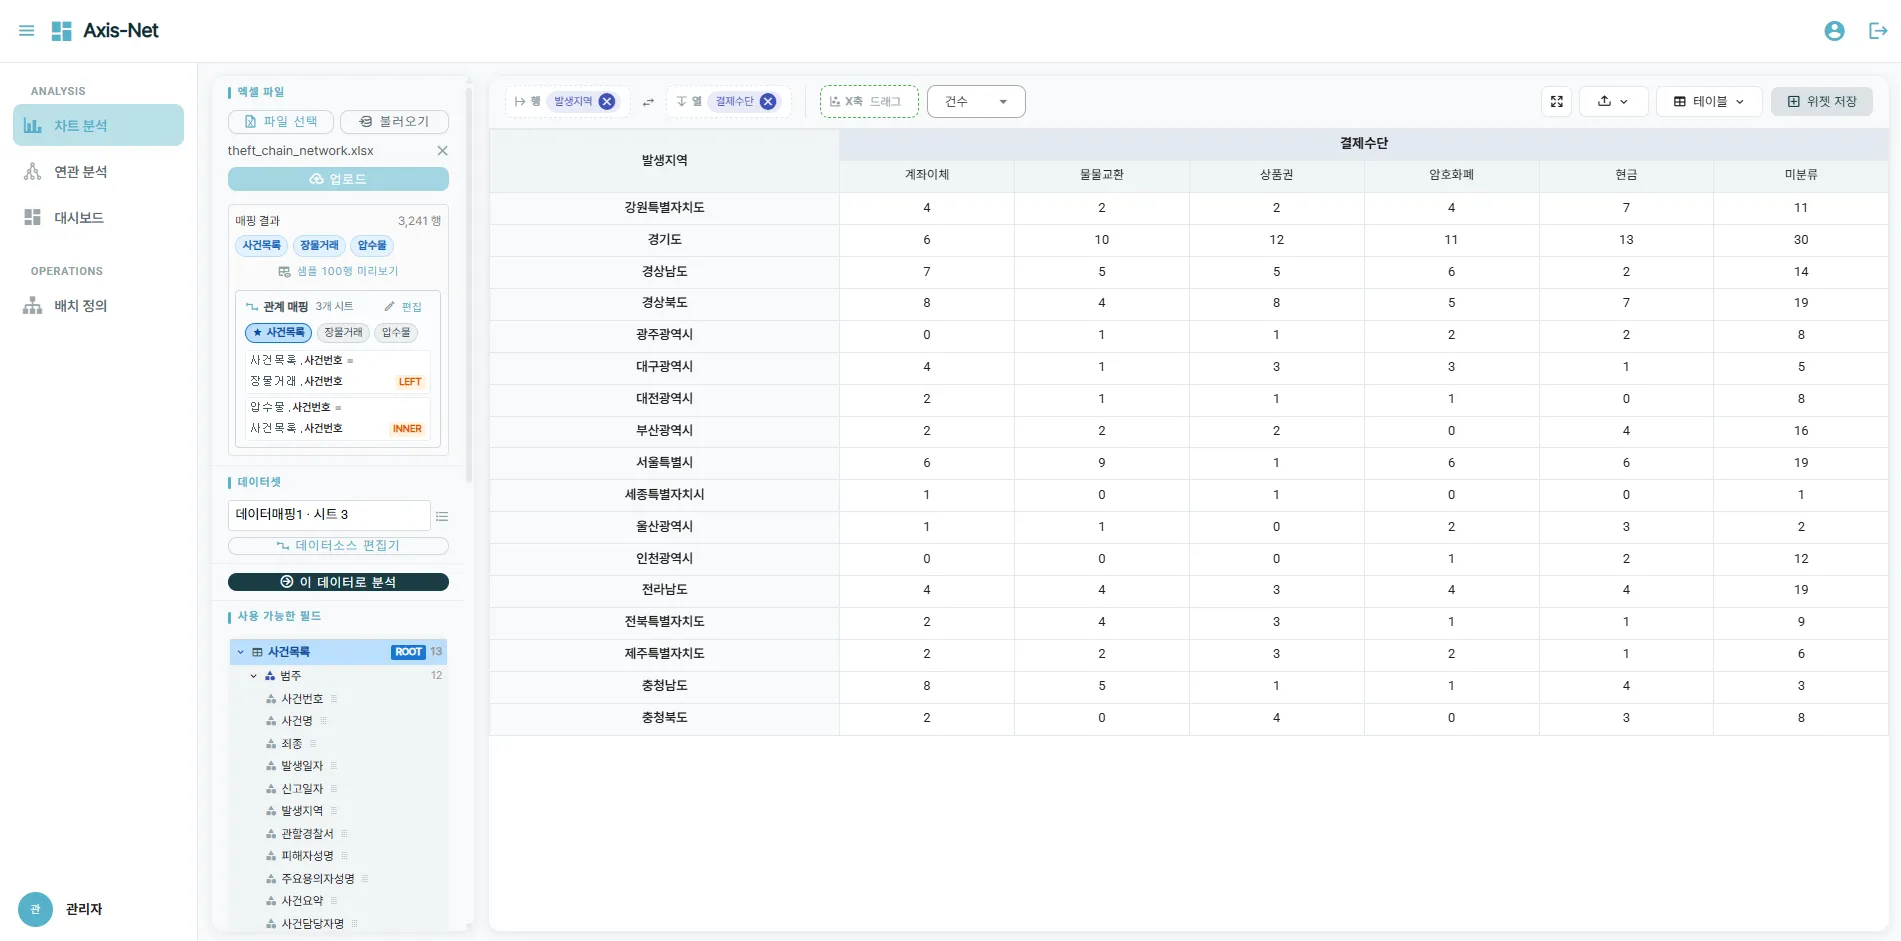
Pivot-driven Visualization
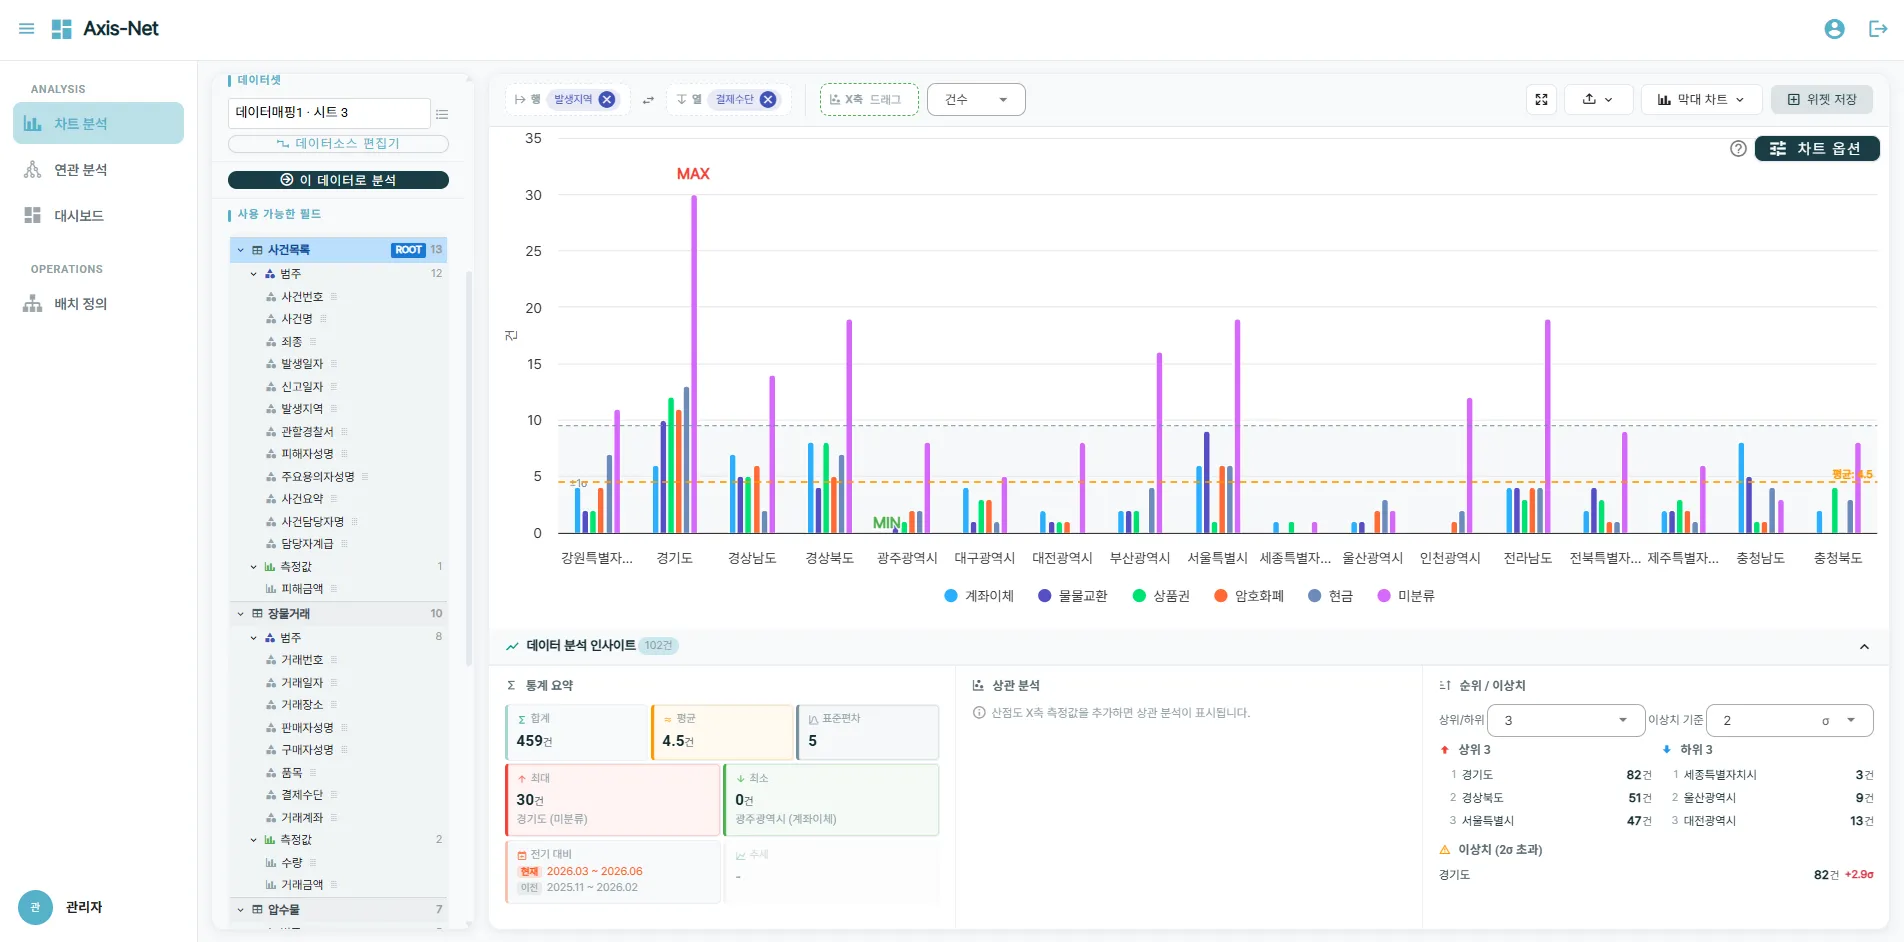
Charts are rendered instantly by dragging and dropping rows/columns on the same dataset. Switch and compare 16 chart types across 4 groups—from standard time-series to distributions, matrices, and maps—and toggle on reference lines like the mean, standard deviation, regression line, and confidence interval (8 in all). Right-clicking a chart point drills down to the raw data, and individual charts can be exported in five different formats.
- 4 Groups & 16 Chart Types — Standard / Ratio & Composition / Distribution, Matrix, Correlation / Maps
- 8 Reference Lines + Multi-dimensional comparison using Small Multiples
- Drill-down — Right-click chart point → Raw data list → Single record details
- 5 Export Formats — Clipboard (TSV), Excel (CSV), PDF, PNG, SVG
SUB-SOLUTION 03
Network Analytics
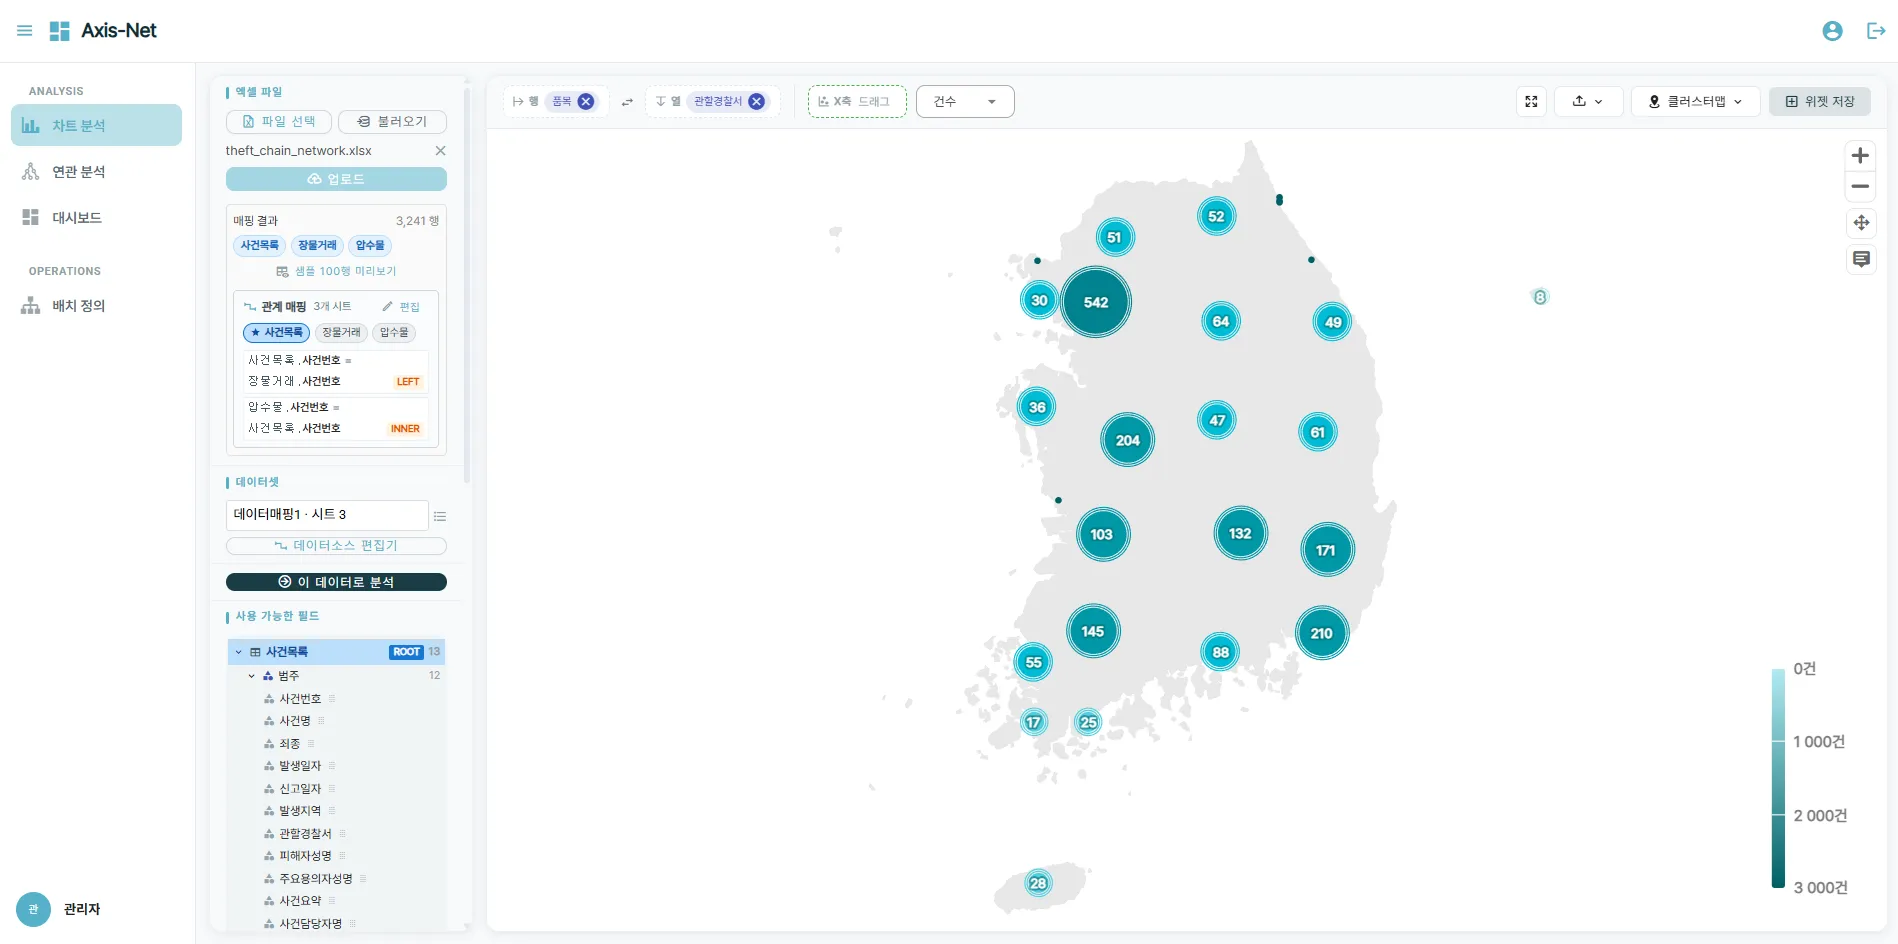
Network Relationship Analytics
Pick an uploaded dataset, then map columns to nodes and their relationships to edges to build a graph. Tune the automatic layout, physics simulation, and edge styles for readability, and use centrality and shortest-path analysis to find the nodes and paths that matter. Expand or remove nodes as you explore, narrow the view by event or keyword, and add a timeline to see how occurrences spread over time—all on one screen. Save a finished graph to a file and reload it anytime.
- Graph Mapping — Explicit definition of Column → Node (Key/Property), Node → Edge (Type/Source/Target)
- 4 Centrality Analyses — Degree, Betweenness, Closeness, PageRank
- Shortest Path Analysis — Identifies paths and distances between two nodes
- Node Expansion/Deletion — Progressive exploration of areas of interest via 1-hop / N-hop expansion
- Search Entry — Narrow down candidates using events, keywords, or regex to project onto the graph
- Timeline Integration — Simultaneously view the temporal distribution and range of node occurrences alongside the graph
- Graph Persistence — Save to file, reload, and share again
SUB-SOLUTION 04
Custom Dashboard
Custom Dashboard
Save charts and graphs as widgets, then arrange them on a drag-and-resize grid to lay out your screen however you like. Keep separate boards for different topics with multiple dashboard tabs, and fine-tune each one for how you work with position locks, pins, and default views. Every change is saved automatically.
- Widget Catalog — Select and add from saved chart/graph widgets
- Multi-dashboard Tabs + Position Lock, Pin, Default View, Auto-align
Screen Previews
Actual AxisNet screens, walking through the key steps from data upload and field matching to chart visualization and network analytics.
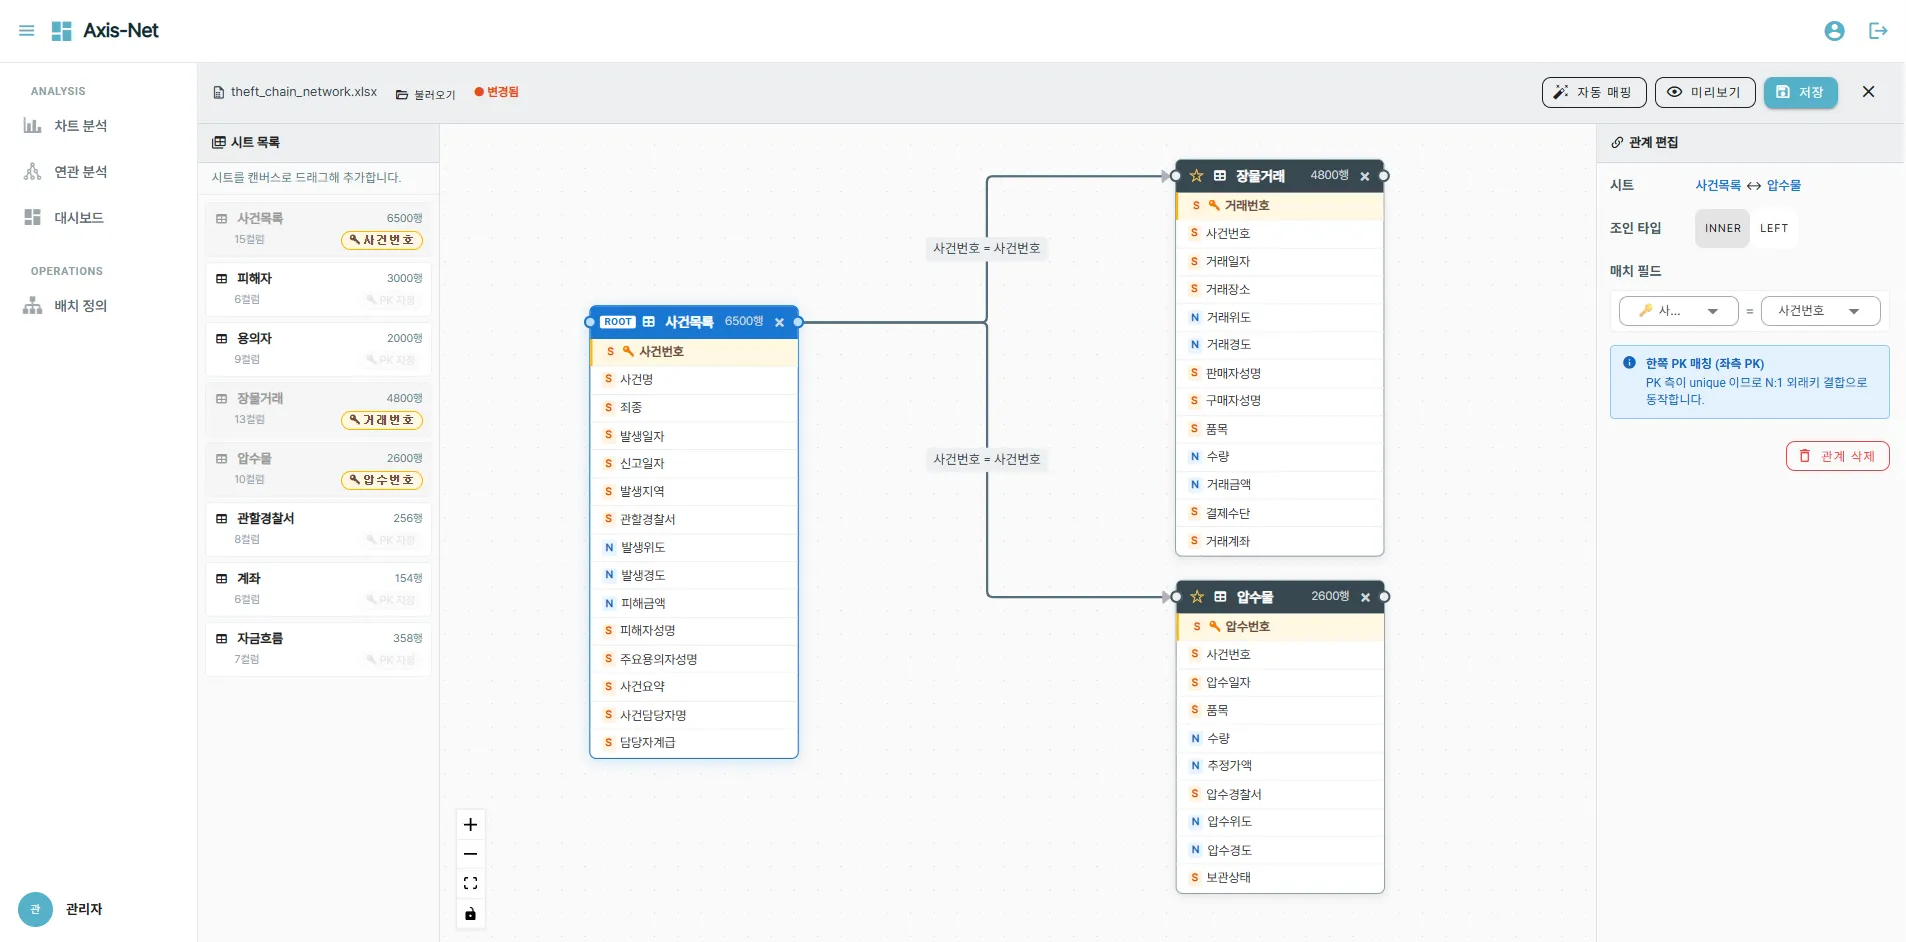
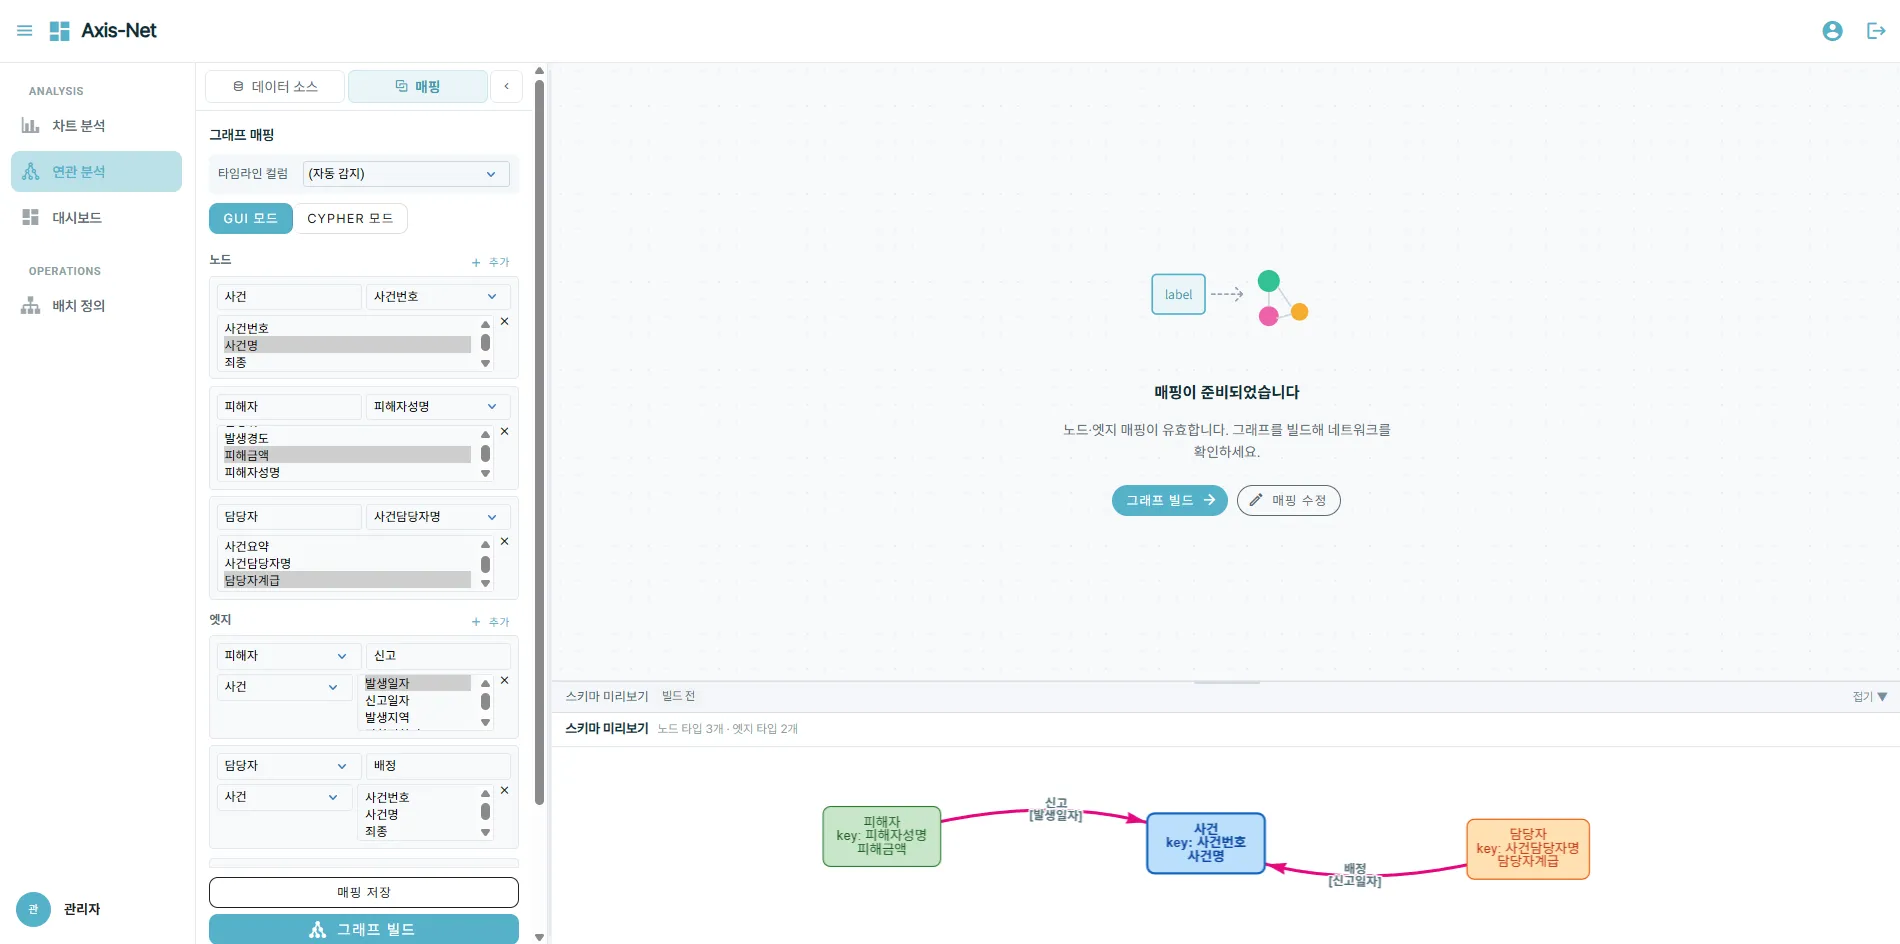
※ Data shown in screens are anonymized samples for demonstration.
Use Cases
- 2024Korean National Police Agency
『Next-Generation Forensic Science Platform』 Project
Used for data analysis and relationship visualization.
- 2023Korean National Police Agency
『Cyber International Cooperation Portal System Enhancement』 Project
Used for data analysis and relationship visualization.
The operating environment — OS, server specs, storage — is sized per SI project according to data scale and requirements. Specific product selection and operating environment are also decided per project.
Considering Cubiware for your organization?
We will guide you through setup and rollout tailored to your requirements and operating environment. Reach out for a demo or a proposal.